Community Science: Engaging the community in data colletion

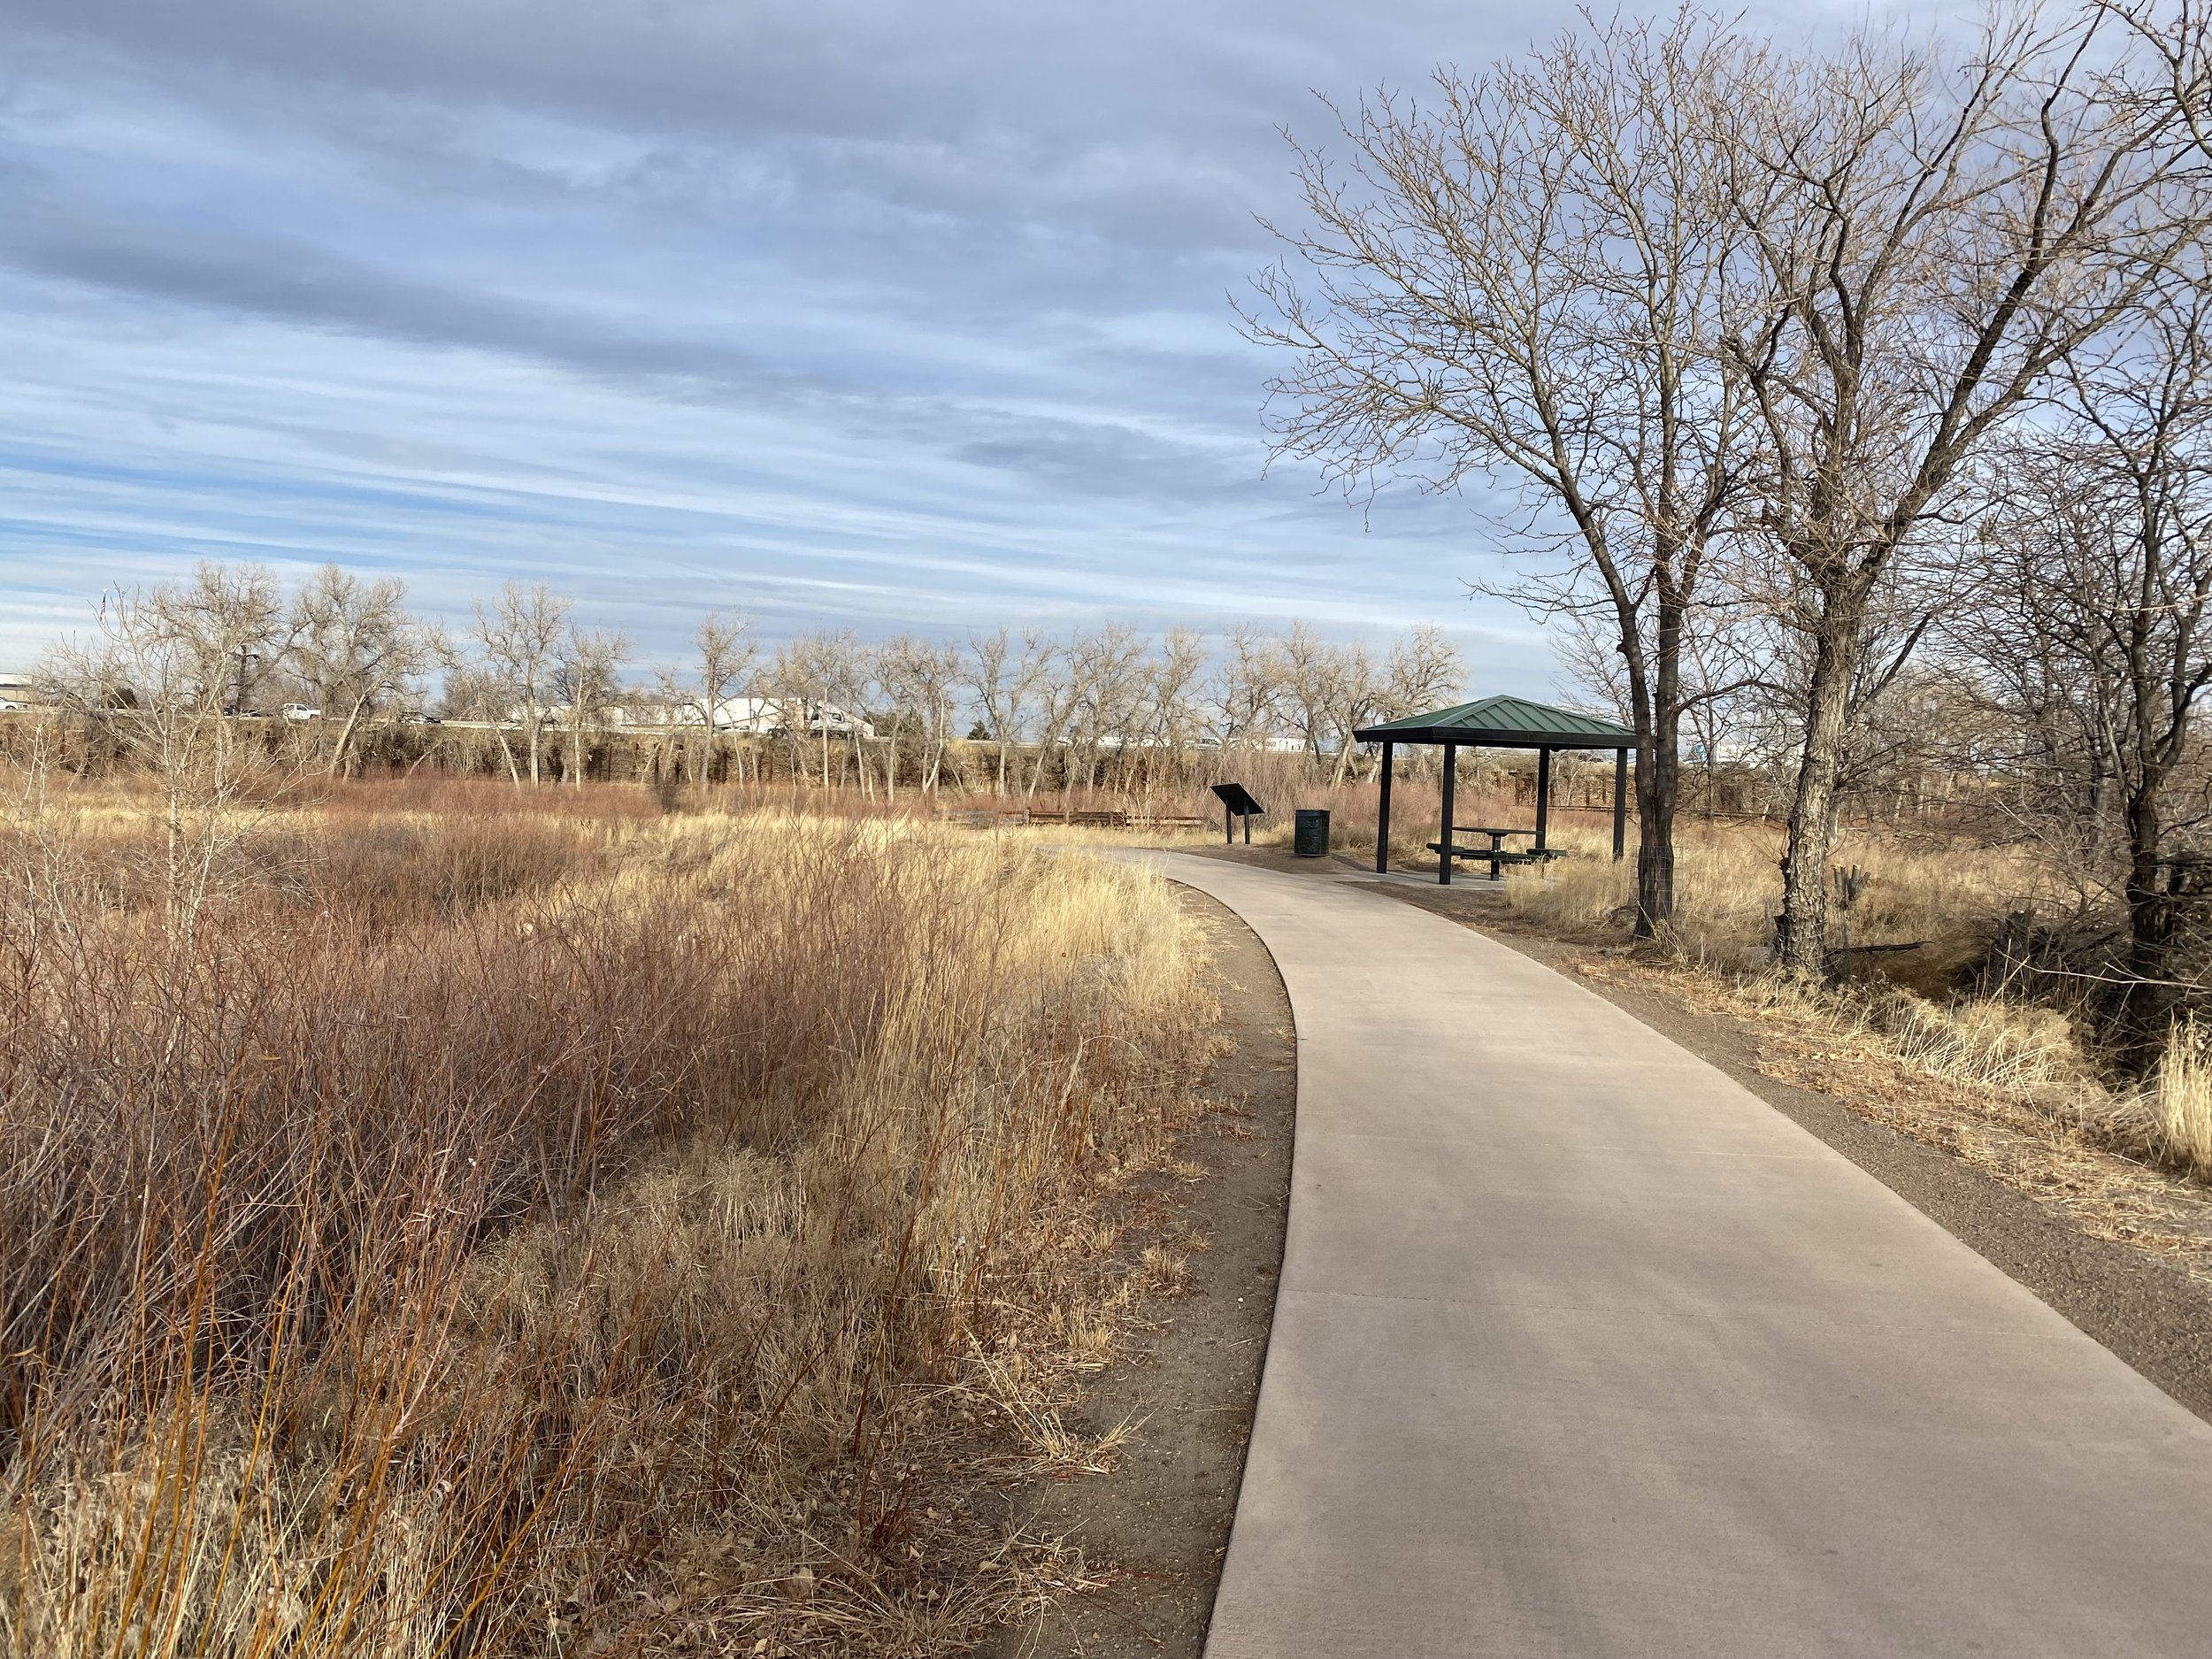
community science on the greenway
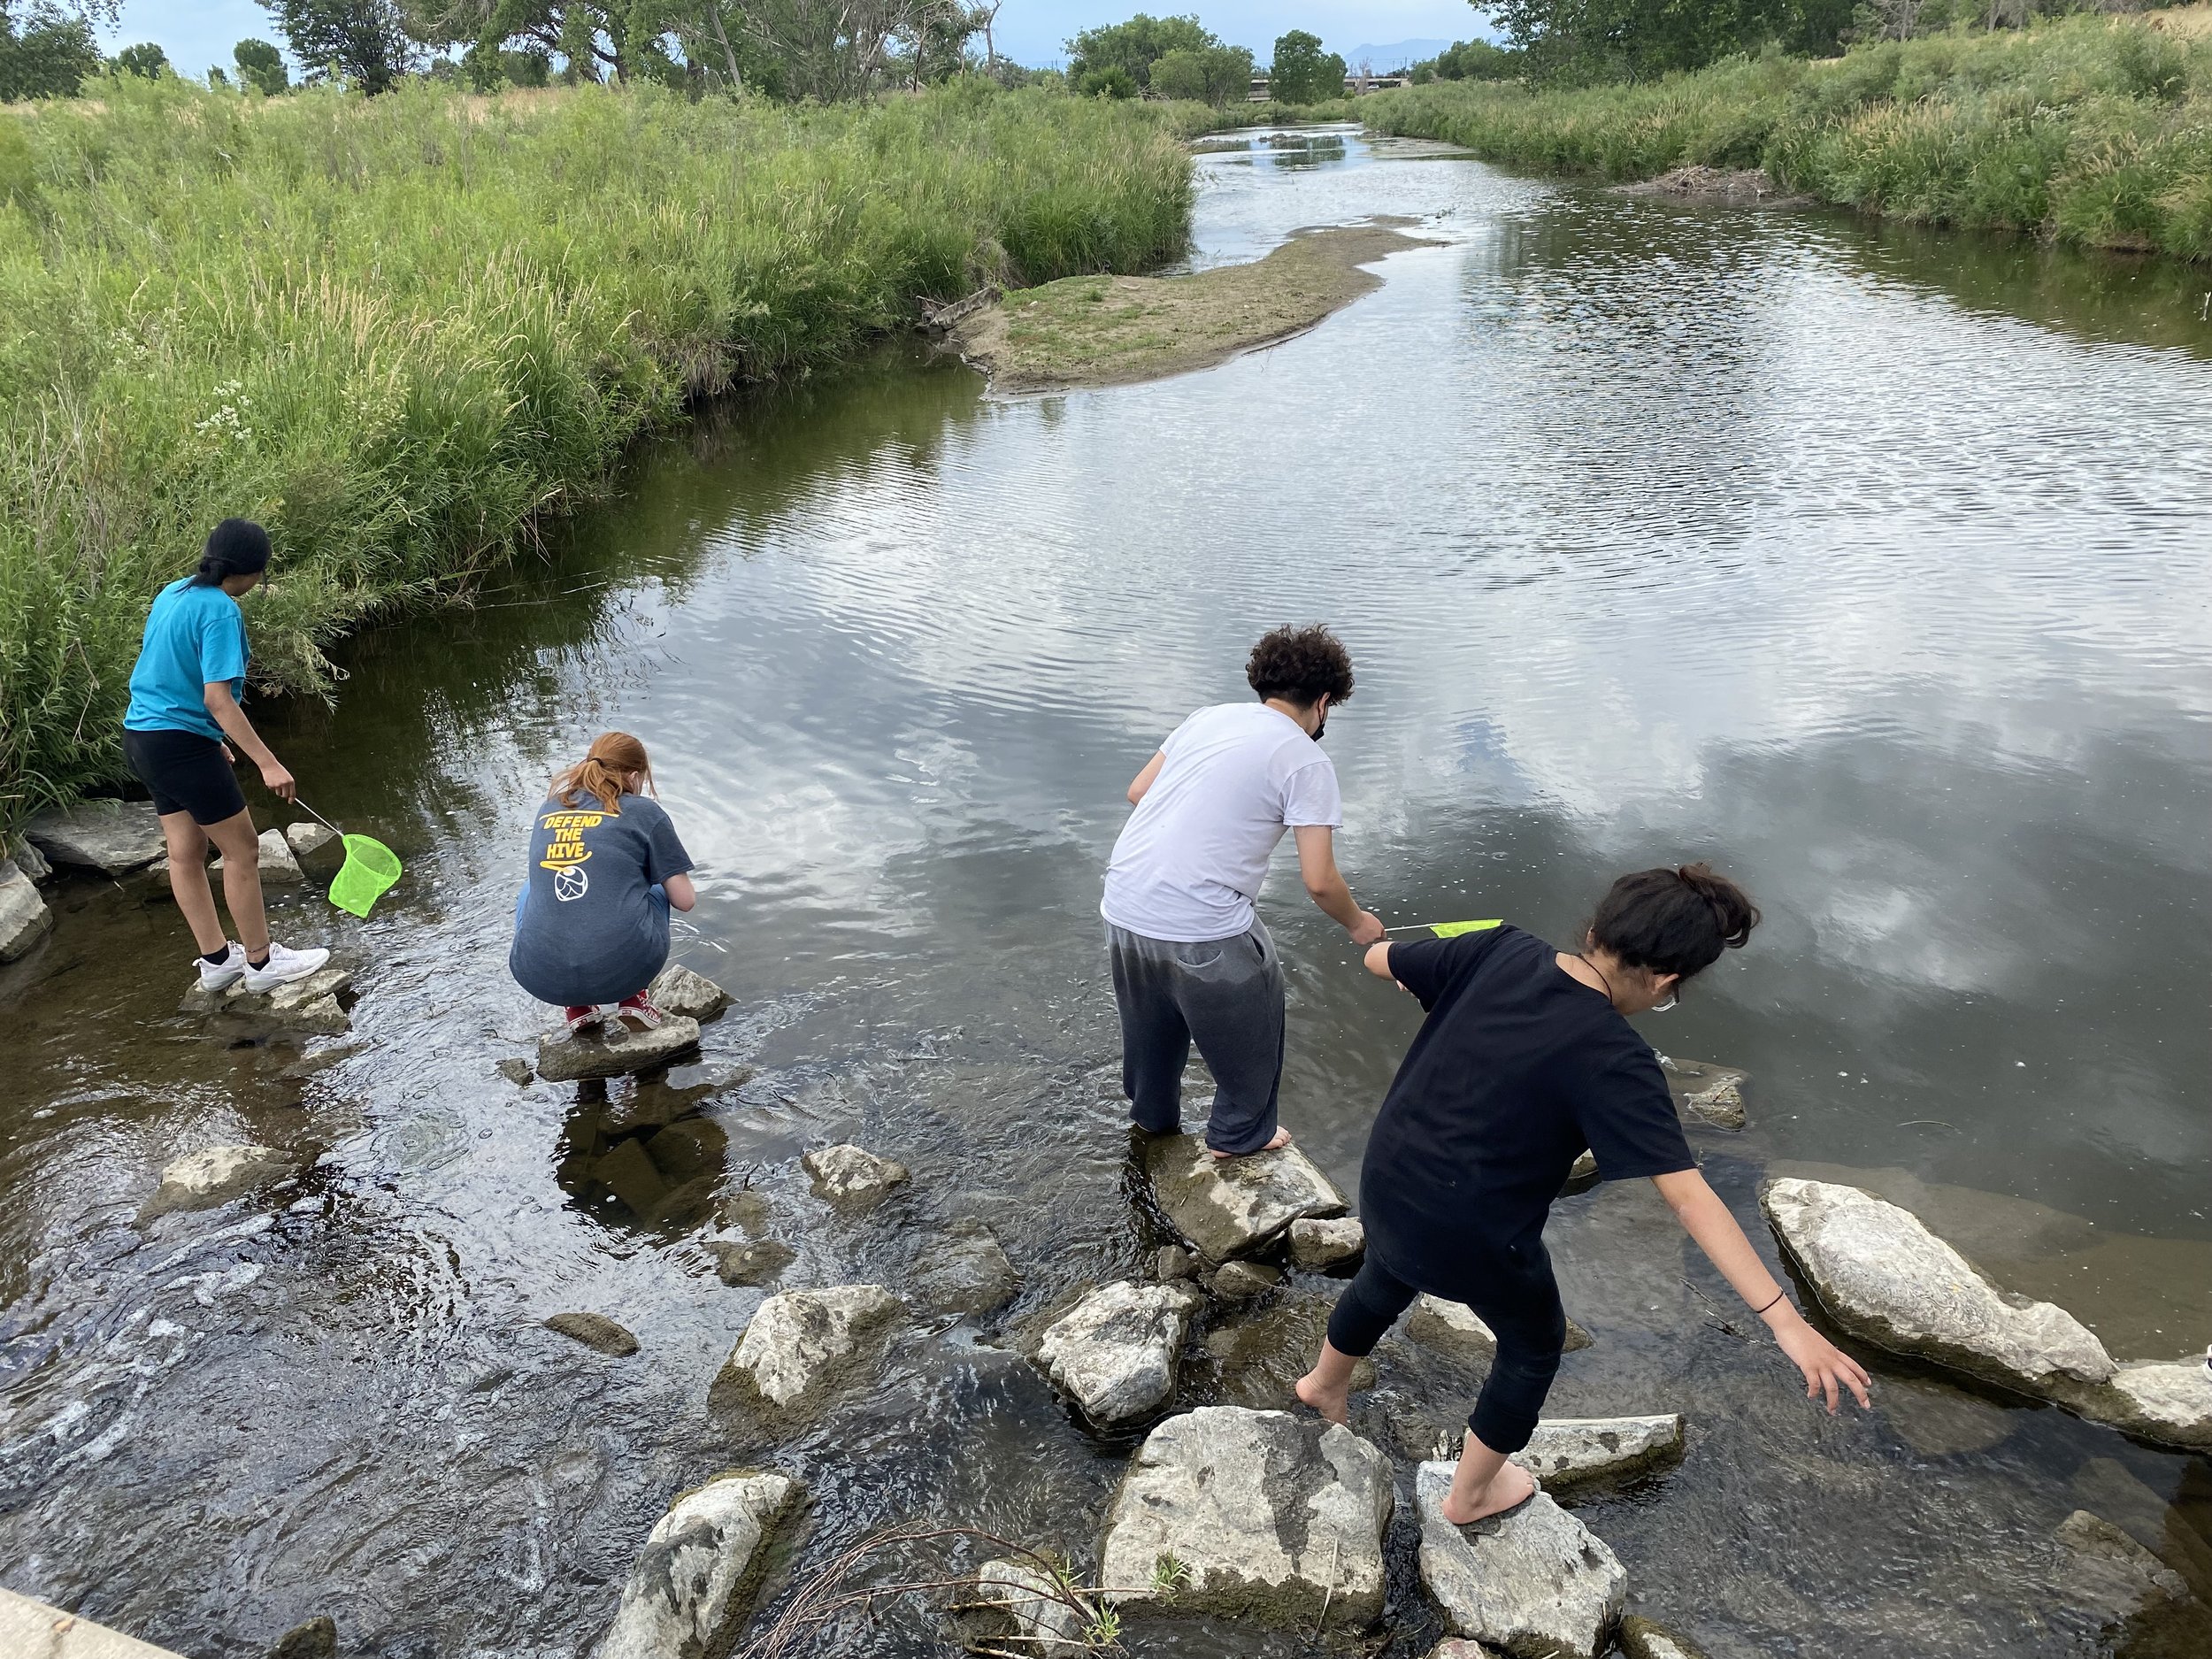
The SCRGP’s Community Science Program is a community-driven initiative aimed at collecting wildlife habitat quality data along the Sand Creek Greenway. The data gathered during this program will be the first of its kind on the trail! It will inform the SCRGP, the community, and stakeholders, of much-needed information about the health of the water and its relation to the surrounding habitats and wildlife. Community members are helping with:
Water quality monitoring
Vegetation composition analysis
Bird diversity tracking
Removal of trash and noxious weeds from the trail
We aim to empower local communities by providing them with the opportunity to contribute to the collection of this data, while also teaching them how they can be stewards to the green spaces in their backyards.
Interested in learning more about the water quality of the Sand Creek? Wondering how many pounds of litter and invasive weeds we’ve removed from the trail? Check out our data below!
What are we testing for?
-

pH
pH, which stands for “potential of hydrogen” is a measure of hydrogen ions in a substance. It is measured on a scale of 1 to 14, with 7 being neutral, greater than 7 being basic, and less than 7 being acidic. It is important to measure pH because aquatic organisms have a pH range in which they can survive in water. This range is approximately 6 to 8.5.
-

Phosphate
Phosphate is a nutrient found in aquatic ecosystems that can come from natural and introduced sources. A source of phosphate in rivers that many people are surprised by is household cleaners. Too many nutrients in the water can lead to a phenomenon called eutrophication, which leads to excess plant growth and low oxygen in the water.
-

Nitrate
Nitrate is another nutrient that can cause eutrophication in rivers. A common source of phosphate comes from dog waste. To help reduce levels of nitrate in your local streams, make sure to pack out your pup’s poop!
-

Dissolved Oxygen
Dissolved oxygen is a measure of how much oxygen is present in water. If dissolved oxygen level are too low it can kill aquatic organisms like fish and macroinvertebrates.
-

Turbidity
Turbidity is a measure of how “cloudy” water is and indicates how much excess sediment there is in the water. Too much sediment can affect fish from flowing freely through a stream and can lead to flooding. Excess sediment can also hold pollutants such as bacteria and heavy metals in the water.
-

Temperature
Temperature is a measure of how hot or cold a substance is. Similar to pH and dissolved oxygen, a certain temperature range is needed for aquatic organisms to remain happy and healthy.
Wondering what current streamflow conditions look like?
In partnership with USGS, Metro Water Recovery installed a camera at their Sand Creek streamflow gauge. Click here to find a time-lapse video of the past 24 hours at this site AND real-time and historical stream flow data!
Data Collected So far
Please note: The water quality data found below was collected directly by community members using LaMotte Water Quality Testing Kits to maximize user friendliness, cost, and data consistency. An example of the testing kits we used can be found at this link. In addition to the data collected by community members we are grateful to our community partners, Metro Water Recovery and River Watch of Colorado, who offered us the opportunity to collect more precise, in-depth data. This data can be found at the links below:


Pounds of Litter + Noxious Weeds Removed from the
greenway since January 2023


Interested in learning more about the birds and plant species found along the greenway?!? Visit our Animal and Plants Page!